Triangle Digital Research · March 2026

NYC Local Law 97
Adoption Curve &
Compliance Timeline

A data-driven analysis of LL97 compliance rates from 2024 to 2050, comparing the as-written cliff scenario against a stakeholder aligned tightening approach — and what it means for 50,000 NYC buildings and their owners.

SCROLL
Key Metrics

The Scale of the Compliance Challenge

LL97 applies to approximately 50,000 buildings across New York City. The law's phased emissions caps create dramatically different compliance dynamics depending on how the tightening schedule is structured.

Covered Buildings
50,000
buildings >25K sq ft
Source: NYC DOB
2024 Non-Compliant
8%
~4,000 buildings
Source: Urban Green Council, Dec 2024
2030 Cliff Jump
+24,500
buildings in one year
Source: Triangle Digital analysis
Annual Penalty
$268
per tCO₂e over limit
Source: NYC Admin Code §28-320
2030 Penalty Pool
$512M
annual citywide exposure
Source: Triangle Digital analysis
Compliance Timeline

Carbon Reduction Requirements by Phase

LL97 mandates a −40% reduction by 2030 and net-zero by 2050 relative to 2005 baselines. Limits are set as absolute emissions intensities (tCO₂e/sq ft) — not percentage cuts from a building's own baseline — meaning older, less efficient buildings face the steepest reductions.

Phase 1 · 2024–2029
−21% avg
~8% non-compliant
Baseline compliance — most buildings pass
Phase 2 · 2030–2034
−40–60%
~57% non-compliant
The cliff — 24,500 buildings fall out overnight
Phase 3 · 2035–2039
~−72%
~62% non-compliant
Deep decarbonization required
Phase 4 · 2040–2049
~−81–91%
~65–68% non-compliant
Near full electrification needed
Net-Zero · 2050+
−100%
~5% residual
Carbon neutral — only deep retrofits remain

Emissions Intensity Limits by Building Type (tCO₂e / sq ft)

Source: NYC Admin Code §28-320; 1 RCNY §103-14; Henderson Engineers (Jan 2024). Phase 3–5 limits projected.

Building Type2024–20292030–2034Phase 2 CutCumul. vs 20052035–2039*2040–2049*
Office (B)0.008460.00453−46%~58%~0.0030~0.0015
Multifamily (R-2)0.006750.00407−40%~49%~0.0027~0.0013
Hotel (R-1)0.012200.00598−51%~60%~0.0040~0.0020
Retail (M/A-2)0.010500.00420−60%~65%~0.0028~0.0014
Healthcare (I-2)0.021400.01050−51%~56%~0.0070~0.0035
Warehouse (S)0.004200.00210−50%~58%~0.0014~0.0007
The 2030 Cliff is the Single Most Consequential Event

The law does not require a uniform percentage reduction from each building's own emissions. It sets an absolute cap that tightens over time. A 1960s-era office tower burning #4 fuel oil may need to cut its actual emissions by 60–70% just to meet the 2030 limit — while a modern LEED-certified tower may already comply through 2034 with no changes. The 2030 phase transition requires a 40–60% reduction in allowable intensity in a single year, sweeping 24,500 additional buildings into non-compliance overnight.

LL97 Compliance Phases

LL97 Six Phases to Achieve Net-Zero

LL97 establishes phased compliance thresholds tightening every five years from 2024 through 2050.

Left axis: % non-compliant buildings  |  Right axis: Total citywide carbon footprint (MtCO₂e)
2024–20292030–20342035–20392040–20442045–204920500%20%40%60%80%Non-Compliant %0 Mt20 Mt40 Mt70 MtCarbon Footprint (MtCO₂e)
  • Cliff Avg %
  • Smoothed Avg %
  • Carbon Footprint (MtCO₂e)
Phase 1
2024–2029
7%
cliff avg
Initial limits take effect. 92% of buildings compliant at launch.
Emissions Limit0.00846 tCO₂e/sq ft (office)
Phase 2
2030–2034
46%
cliff avg
Major tightening. 57% of buildings non-compliant at 2030 onset under cliff scenario.
Emissions Limit0.00453 tCO₂e/sq ft (office) — 46% tighter
Phase 3
2035–2039
49%
cliff avg
Further reductions required. Deep energy retrofits become necessary.
Emissions Limit~0.0030 tCO₂e/sq ft (projected)
Phase 4
2040–2044
50%
cliff avg
Near net-zero trajectory. Electrification and renewables essential.
Emissions Limit~0.0020 tCO₂e/sq ft (projected)
Phase 5
2045–2049
48%
cliff avg
Final approach to net-zero. Residual non-compliance declines sharply.
Emissions Limit~0.0010 tCO₂e/sq ft (projected)
Net-Zero
2050
5%
cliff avg
LL97 net-zero target year. Both scenarios converge at ~5% residual non-compliance.
Emissions LimitZero emissions
Phase Rollout Impact

NYC Citywide GHG Reduction: 2024–2050

NYC building sector emissions (MtCO₂e) declining from the 2024 baseline of 58 MtCO₂e as each LL97 phase tightens limits. The blue dashed line shows the accelerated impact when Fortune 1000 and SBTi companies proactively cover their carbon footprint.

202420292034203920442049015304560MtCO₂ePh2Ph3Ph4Ph5Net-Zero
  • LL97 Smoothed
  • Smoothed + F1k/SBTi
  • LL97 As-Written (Cliff)
2024 Baseline
58.0 MtCO₂e
NYC buildings sector
F1k/SBTi Uplift
+26.7%
Faster reduction vs LL97 alone
Net-Zero 1 Year Earlier
2049
With corporate voluntary action
Sources: NYC Mayor’s Office of Climate & Environmental Justice (2023); Urban Green Council Benchmarking Update (Dec 2024); Triangle Digital analysis.
Interactive Tool

Building Penalty Calculator

Estimate your building's LL97 fine exposure for 2024 (Phase 1) and 2030 (Phase 2 — Cliff), and see how a smoothed annual tightening program would reduce that burden. Compare the cost of paying the fine against purchasing Triangle Digital compliance credits.

Building Parameters
LL97 applies to buildings >25,000 sq ft
Class A/B office towers, commercial buildings
Use custom emissions intensity (tCO₂e/sq ft/yr) — override default for your building
Phase 1 (Current)
As-Written
NON-COMPLIANT
$28K
estimated annual fine
Actual emissions950 tCO₂e
2024 limit846 tCO₂e
Excess over limit104 tCO₂e
Credit cost (vs fine)$5K
Phase 2 — Cliff
As-Written
NON-COMPLIANT
$133K
estimated annual fine
Actual emissions950 tCO₂e
2030 limit453 tCO₂e
Excess over limit497 tCO₂e
Credit cost (vs fine)$22K
Phase 2 — Smoothed
5% Annual Tightening
NON-COMPLIANT
$86K
estimated annual fine
Actual emissions950 tCO₂e
2030 limit630 tCO₂e
Excess over limit320 tCO₂e
Credit cost (vs fine)$14K
Smoothed vs. Cliff Savings (2030)
$47K
annual fine reduction with smoothed program
Credits vs. Fine (2030 Cliff)
$111K
saved by buying Triangle credits vs. paying fine
Excess Emissions (2030 Cliff)
497 tCO₂e
above the 2030 limit requiring compliance credits
* Estimates use NYC LL97 Table 2 emissions limits and a default emissions intensity for the selected building type. Actual fines depend on your building's benchmarked emissions from NYC DOB filings. Credit cost assumes $45/tCO₂e for Triangle Digital verified assets. Source: NYC Local Law 97 (Int. 1253-A), Urban Green Council, NYC DOB.
Policy Reform

Improving LL97

Addressing structural flaws for market adoption — four critical reforms needed to ensure the long-term viability and success of NYC's decarbonization program.

01
Reporting Disconnect
Current reliance on Energy Star creates duplicate reporting vs. the global GHG Protocol. Energy Star is partial and non-conforming to international standards — creating friction for multinational tenants and building owners with global ESG reporting obligations.
02
Targeted Prioritization
The mandate should start with the biggest buildings and worst emitters (e.g., Large Accelerated Filers) rather than a blanket approach that overwhelms the market. Focus enforcement where the carbon reduction opportunity is greatest.
03
Greenwashing Risks
NYC-issued credits pose a tremendous risk for greenwashing to the city, as they currently do not factor in electricity reductions in their estimates. The NYC Comptroller's 'Cap the Credits' report (2024) flagged this as a systemic risk to program integrity.
04
Market Adoption
Addressing these flaws is critical to mitigating market pushback and ensuring the long-term viability and success of the decarbonization program. Without credible standards, building owners will concentrate efforts to derail implementation.
05
NYC Construction Cost & Time Barrier
Building in NYC costs 3× more and takes 3× longer than comparable projects in other U.S. markets — making deep energy retrofits economically prohibitive for many owners. A targeted reform pathway: NYPA can deliver clean electrons to the city by expanding upstate renewable capacity (wind, solar, hydro), reducing the need for costly on-site generation and dramatically lowering the capital hurdle for LL97 compliance.
06
Scope 3 Reductions & Green Debt Premium
Expanding LL97 to recognize Scope 3 reductions — including tenant commuting, business travel, and supply chain emissions — unlocks a powerful financial incentive: buildings and tenants that demonstrate verified Scope 3 progress can capture a 16 basis point (bps) greenium on debt financing. At scale across NYC's commercial portfolio, this translates to hundreds of millions in annual interest savings, creating a self-funding compliance flywheel.
Transition Strategy

Transition Strategy — Non-Compliant, Fortune 1000 and SBTi

The total addressable market has two ends: non-compliant building owners driven by LL97 penalty avoidance, and Fortune 1000 / SBTi-committed tenants driven by corporate ESG mandates. Together they represent a ~$1.02B annual market.

Shared Compliance

The Efficient Equation

Aligning LL97 compliance with corporate net-zero goals — every dollar a tenant spends on carbon compliance is one less the building owner needs to spend. Provide an efficient mechanism of value transfer to align with global Scope 3 reporting frameworks and regulated and verified carbon credit assets.

Building Owner
🏢
Legally responsible for LL97 compliance and faces $268/ton penalties.
Needs capital to fund retrofits or purchase compliance credits.
Seeks to minimize operational cost increases to maintain asset value.
SHARED
SOLUTION
Fortune 500 / SBTi Tenant
🌿
Committed to aggressive Scope 3 emissions reductions globally.
Requires verified, high-quality carbon credits to meet corporate ESG mandates.
Willing to invest in sustainability to satisfy shareholders and employees.
CITY
BENEFIT
NYC Government
🏛️
Reduce borrowing costs by $197M annually — capturing the 15bps Greenium on NYC municipal debt through verified LL97 progress.
Provide a credible, data-driven transition plan that city stakeholders, unions, and businesses can align behind.
Restructure LL97 from a compliance burden into a shared economic opportunity — distributing both responsibility and upside across building owners, tenants, and the city.
The Shared Solution
Cost Sharing
Every dollar a tenant spends on carbon compliance is one less the building owner needs to spend — aligning incentives naturally.
Dual Compliance
Triangle's Verified & Regulated Assets satisfy both LL97 building requirements and corporate Scope 3 mandates simultaneously.
Global Precedent
Similar tools are being applied to the Carbon Border Adjustment Mechanism (CBAM) in the EU, validating this approach internationally.
Phase Rollout Impact

NYC Citywide GHG Reduction: 2024–2050

NYC building sector emissions (MtCO₂e) declining from the 2024 baseline of 58 MtCO₂e as each LL97 phase tightens limits. The blue dashed line shows the accelerated impact when Fortune 1000 and SBTi companies proactively cover their carbon footprint.

202420292034203920442049015304560MtCO₂ePh2Ph3Ph4Ph5Net-Zero
  • LL97 Smoothed
  • Smoothed + F1k/SBTi
  • LL97 As-Written (Cliff)
2024 Baseline
58.0 MtCO₂e
NYC buildings sector
F1k/SBTi Uplift
+26.7%
Faster reduction vs LL97 alone
Net-Zero 1 Year Earlier
2049
With corporate voluntary action
Sources: NYC Mayor's Office of Climate & Environmental Justice (2023); Urban Green Council Benchmarking Update (Dec 2024); Triangle Digital analysis.
Corporate Tenant Exposure

Fortune 1000 & SBTi Companies in NYC

Beyond building owners, major corporate tenants face independent ESG obligations — creating a second, voluntary demand stream for compliance assets. These companies occupy space across hundreds of LL97-regulated buildings.

Fortune 1000 in NYC
43
Fortune 500
HQ'd in NYC
66
Fortune 1000
HQ'd in NYC
~200+
Additional
major offices
Estimated buildings occupied
~1,200–1,500
across LL97-regulated stock
Estimated total sq ft leased
~120–140M sq ft
Manhattan office inventory
Avg sq ft per HQ company
~1.0M sq ft
Fortune 500 NYC HQ
Avg sq ft per satellite office
~250–400K sq ft
Fortune 1000 non-HQ
Source: us500.com (Jan 2, 2026); NYC Comptroller Office Market Report (Nov 2025); NYC OSC Office Sector Report
SBTi-Committed Companies in NYC
10,000+
Global SBTi
validated targets
~300
NYC Presence
est. ~3% of global
~120
F500 + SBTi
overlap in NYC
Estimated buildings occupied
~400–600
across LL97-regulated stock
Estimated total sq ft leased
~45–68M sq ft
NYC office inventory
Avg sq ft per SBTi company
~150–225K sq ft
NYC office presence
Scope 3 voluntary spend potential
~$51M/yr
at $0.75/sq ft carbon spend
Source: SBTi milestone announcement (Jan 22, 2026); Triangle Digital analysis; NYC office market data
Combined Corporate Footprint
Fortune 1000 and SBTi companies together occupy an estimated ~165–200M sq ft of NYC office space across 1,500–2,000+ buildings — the majority of which are subject to LL97 compliance requirements.
~165–200M
Combined Sq Ft
~1,500–2,000+
LL97 Buildings
ESG + LL97
Dual Motivation
Transition Strategy: Non-Compliant Buildings on the left, Fortune 1000 + SBTi on the right, Triangle Digital in the center
Left Bar — Compliance-Driven
$900M
Annual citywide penalty pool from 31,500 non-compliant buildings at $268/ton
Non-compliant buildings31,500
Penalty rate$268/tCO₂e
Avg excess per building~67 tCO₂e
Barbell Total TAM
~$1.02B
Annual addressable market combining compliance-driven and ESG-driven demand
F1000 + SBTi Priority Segment
~$248M
Compliance + voluntary ESG spend
Right Bar — ESG-Driven
$124M
Incremental voluntary Scope 3 spend from Fortune 1000 & SBTi-committed tenants
Fortune 500 HQ'd in NYC43 companies
Fortune 1000 NYC presence~266 companies
SBTi companies w/ NYC presence~300 companies
Combined unique sq ft~165M sq ft
Strategic Insight

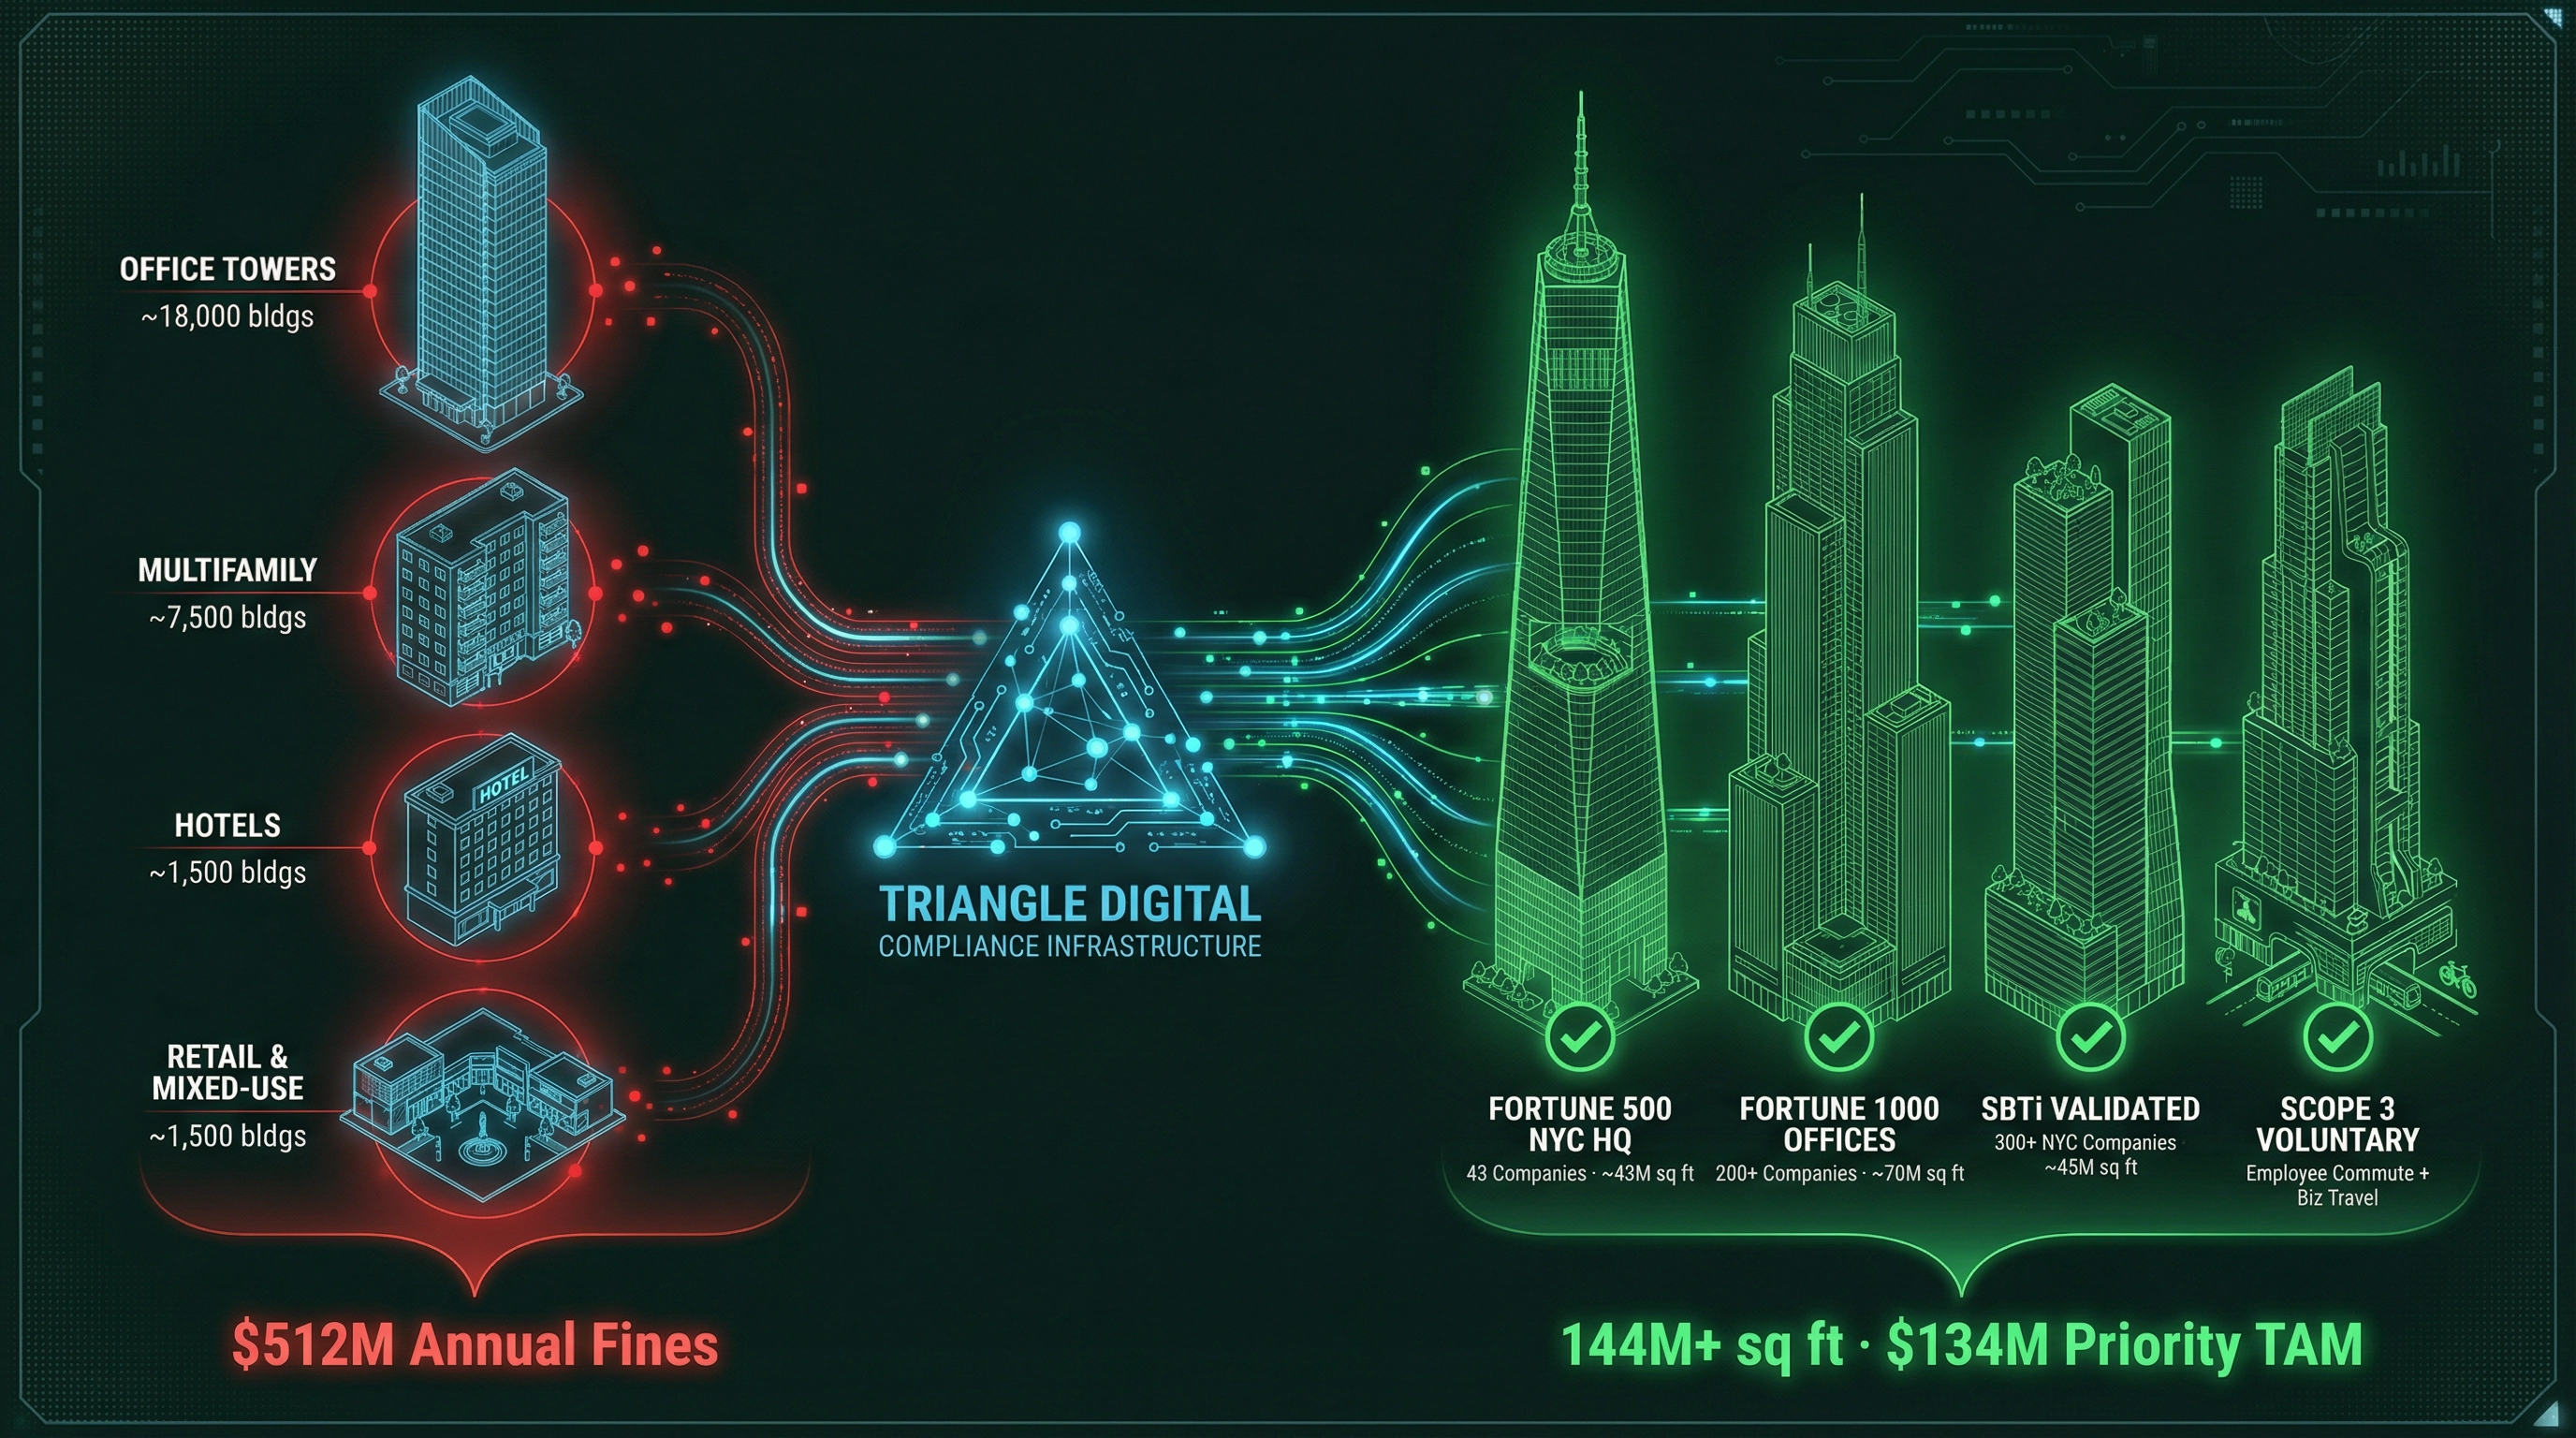
The Fortune 1000 + SBTi segment represents ~24% of total TAM by dollar value, but is disproportionately valuable because these buyers have dual motivation: they are driven by both LL97 compliance obligations AND their own Scope 3 corporate targets — meaning they will pay a premium for verified, DABA-registered assets over generic offsets or NYC-issued credits.

Winning one Fortune 1000 tenant relationship (e.g., JPMorgan, Goldman Sachs, Pfizer, Deloitte, or Accenture) can unlock compliance spend across dozens of buildings in their portfolio simultaneously. SBTi-committed companies are also under intense scrutiny and will specifically seek out institutional-grade assets over credits flagged by the NYC Comptroller as greenwashing risks.

Compliance Strategy

Smoothing the 2030 Cliff

Avoiding market shock through incremental adoption — replacing a single catastrophic liquidity event with a predictable, manageable compliance ramp.

The Current 2030 Cliff
Sudden 46% Drop
Emissions limits remain flat until 2029, then drop drastically overnight.
💸
Capital Shock
A 1M sq ft tower's compliance cost jumps from ~$1.2M to ~$2.7M in a single year.
🚨
Market Panic
Triggers a rushed, uncoordinated scramble for credits and retrofits in late 2029.
🚧
Obstruction Risk
Participants concentrate efforts to derail implementation when faced with sudden shock.
Smoothed Adoption Curve
📈
5–8% Annual Tightening
Gradual reduction starting from the 2024 baseline — predictable and manageable.
🏗️
Predictable CapEx
Replaces a sudden capital shock with a manageable, escalating operational expense.
📊
Stable Credit Market
Fosters steady, predictable demand growth, allowing institutional credit infrastructure to scale efficiently.
⚖️
Barbell Approach
Combine non-compliant building owners with Fortune 500/SBTi company participation for market depth.

"A smoothed program eliminates the $9.3B single-year liquidity shock, creating a stable environment where institutional-grade carbon assets can thrive."

Adoption Curve Analysis

Cliff vs. Smoothed: 2024–2050

The as-written law creates four separate market shocks — one at the start of each 5-year compliance period. A smoothed approach (5–8% annual tightening) produces a single manageable arc, peaking at ~36% non-compliance around 2037–2038 before declining steadily to net-zero.

Phase 1 2024–2029
Phase 2 2030–2034
Phase 3 2035–2039
Phase 4 2040–2044
Phase 5 2045–2049
2024202520262027202820292030203120322033203420352036203720382039204020412042204320442045204620472048204920500%20%40%60%80%2030 Cliff
  • Cliff Scenario
  • Smoothed (from 2024)
  • Smoothed (from 2027)

Sources: Urban Green Council Benchmarking Update (Dec 2024); NYC Mayor's Office of Climate & Environmental Justice (Sep 2023); GT Law LL97 Analysis (May 2025); NYC DOB. Phase 3–5 limits projected based on LL97's stated 80% reduction by 2050 trajectory. Penalty pool uses $268/tCO₂e × avg 67 tCO₂e excess per non-compliant building.

⚠ Cliff Scenario

Four separate market shocks — one every 5 years. Non-compliance jumps from 7% to 57% in a single year at the 2030 threshold. Creates boom-bust cycles that make long-term capital planning impossible.

✓ Smoothed Scenario

A single manageable arc — non-compliance rises gradually to a peak of ~36% around 2037–2038, then declines steadily as retrofits accumulate. Both scenarios converge at 5% by 2050.

◆ Smoothed from 2027

A 3-year delayed start keeps 2024–2026 flat at ~8%, then ramps smoothly. Peak non-compliance shifts to ~38% around 2040 — slightly higher and later than the 2024 start — but still converges to 5% by 2050. The delay costs ~3 years of early carbon reduction.

Partner Requirements

Credit Partner Program

To be part of Triangle's credit distribution program, partners must demonstrate a comprehensive commitment to decarbonization — not just building-level compliance — driven by GHG reporting for consistency.

🏗️
Scope 1 & 2
Buildings
Partners must cover their own Scope 1 (direct combustion) and Scope 2 (purchased electricity) emissions across all buildings in their managed portfolio.
GHG Protocol — Direct & Energy Indirect
🚇
Scope 3
Employee Commuting
Partners must account for and offset employee commuting emissions (GHG Protocol Scope 3, Category 7), ensuring the organization's full operational footprint is addressed.
GHG Protocol — Category 7
✈️
Scope 3
Business Travel
Partners must cover business travel emissions (GHG Protocol Scope 3, Category 6), completing the 'whole organization' carbon commitment required for program participation.
GHG Protocol — Category 6

This standard ensures Triangle's distribution network is composed of credible, committed partners — protecting the integrity of the credit market and the value of Triangle-regulated assets.

Partner Requirements

Connecting the Value Chain

Aligning State and Federal value chains to drive shared economic policy — three city programs linked to create a self-reinforcing framework for energy transition, debt cost reduction, and resilience adaptation.

Connecting the Value Chain policy diagram

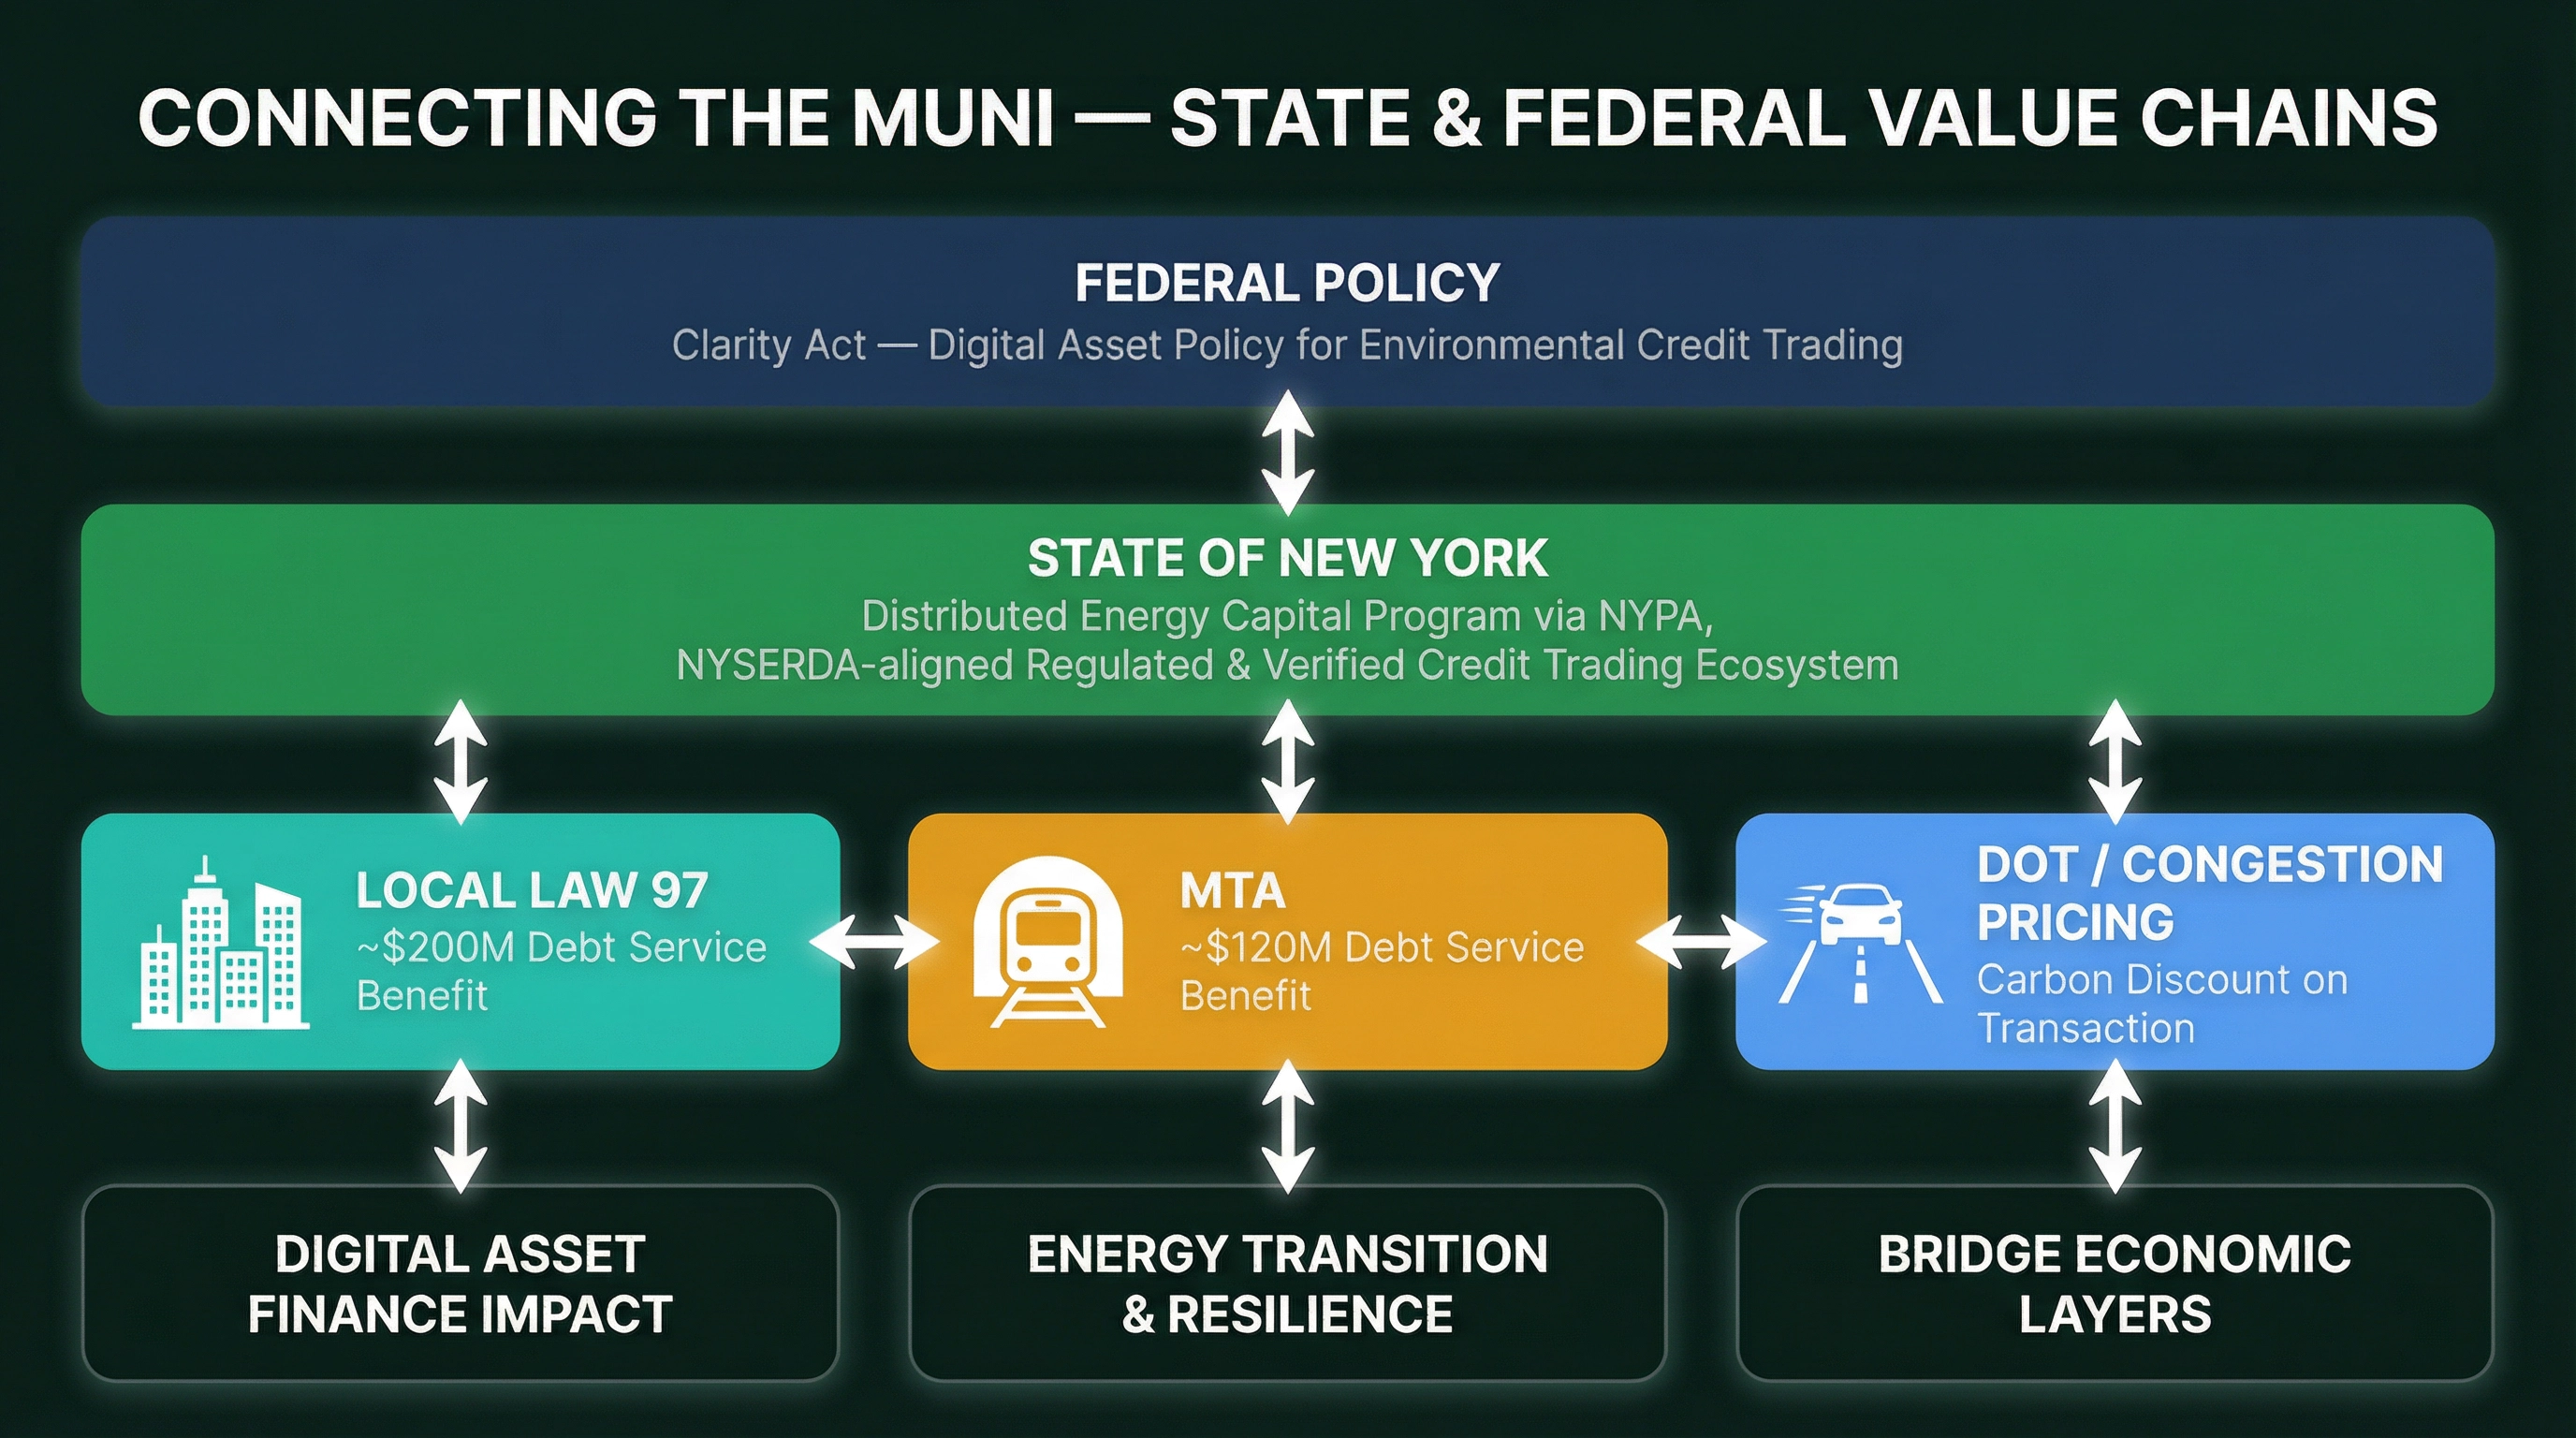
Tri-State Regulated & Verified Environmental Credit Market for LL97 / Scope 3 reporting for F1k & SBTi companies.

Partner Firms
Triangle Digital
TRIANGLE
Accenture
ACCENTURE
CBRE
CBRE
JLL
JLL
Cushman & Wakefield
CUSHMAN & WAKEFIELD
Newmark
NEWMARK
Turtle
TURTLE
3 Connection Points to Drive State Economic Policy
01 — Local Law 97
~$200M Debt Service Benefit

Capture ~$200M in annual debt service cost savings through the 15bps greenium on NYC muni bonds unlocked by LL97 compliance and verified carbon credit assets.

02 — MTA
~$120M Debt Service Benefit

Link to the MTA micro-site program — employee commuting and business travel carbon reduction unlocks ~$120M in annual MTA debt service cost savings through green bond pricing.

03 — DOT / Congestion Pricing
Carbon Discount on Transaction

Fortune 1k / SBTi companies pay for employee commuting carbon associated with congestion pricing transactions — providing a discount mechanism that covers the carbon cost. Cost benefit TBD.

This Program Delivers
Impact to Digital Asset Finance in NYC

Verified carbon credit assets underpin a new layer of digital finance infrastructure — linking compliance obligations to tradeable, regulated instruments.

Energy Transition & Resilience Adaptation

Combines City, State, and Federal policy into a unified energy transition framework — NYPA clean electrons, LL97 demand reduction, and MTA electrification working in concert.

Bridge Between Economic Layers

Sound federal policy aligned with state power distribution, sharing the economic cost across the drivers of the state economy — building owners, corporate tenants, and transit riders.

Join the Program

Be Part of NYC's
Carbon Transition

Triangle Digital is building the Tri-State Regulated & Verified Environmental Credit Market — connecting building owners, Fortune 1000 tenants, and city government into a single, efficient compliance ecosystem.

🏢
Building Owners
Reduce compliance costs and access green debt financing at 16bps below market.
🌍
Fortune 1000 & SBTi Tenants
Satisfy Scope 3 obligations with regulated, verified NYC carbon credits.
🏛️
NYC Government
Capture ~$200M in annual muni debt savings and align city, state and federal policy.
Program Launch
Q3 2026
Target Partners
50+ Firms
Combined Benefit
~$320M / yr
Request a Partner Briefing

Tell us about your organization and we'll schedule a 30-minute overview of the program and your compliance pathway.

Your information is kept confidential and never shared with third parties.

Methodology & Sources

Data Sources & Assumptions

Urban Green Council Benchmarking Update
December 2024 · urbangreencouncil.org

92% of buildings compliant with 2024 limits; 43% of all buildings already meet 2030 limits; 57% will not meet 2030 limits without action.

NYC Mayor's Office — Greenhouse Gas Inventory
September 2023 · nyc.gov

63% of large buildings were already exceeding 2030 targets at time of publication.

GT Law LL97 Analysis
May 2025 · gtlaw-environmentalandenergy.com

2024–2029: ~11% non-compliant; 2030–2034: up to 80% non-compliant if no upgrades made; 2035+: deep retrofits required.

NYC Admin Code §28-320
Local Law 97 of 2019 · nyc.gov

Penalty rate: $268 per metric ton of CO₂e over the applicable emissions limit. Net-zero target: 2050.

SBTi Milestone Announcement
January 22, 2026 · sciencebasedtargets.org

10,000 companies globally have now committed to Science Based Targets, with ~300 estimated to have material NYC presence.

NYC Comptroller — Cap the Credits
2024 · comptroller.nyc.gov

NYC-issued credits present significant greenwashing risk; do not factor in electricity reductions in estimates.

Key Assumptions

Phase 3–5 emissions limits are projected based on LL97's stated 80% reduction by 2050 trajectory, as specific limits have not yet been published by NYC DOB.

Penalty pool calculation uses $268/tCO₂e × average 67 tCO₂e excess per non-compliant building (conservative estimate).

Smoothed scenario models 5–8% annual tightening with no 5-year step changes, analogous to SEC phased disclosure rules.

Fortune 1000 NYC office footprint: 43 F500 HQ × avg 1M sq ft + 150 F500 satellite offices × avg 350K sq ft + 66 F1000 HQ × avg 500K sq ft + 200 F1000 satellite offices × avg 200K sq ft = ~140M sq ft total.

SBTi NYC presence estimated at ~3% of 10,000 global signatories = ~300 companies × 150K sq ft avg = ~45M sq ft. Combined unique Fortune 1000 + SBTi footprint ~165M sq ft (accounting for ~20M sq ft overlap between F1000 and SBTi companies). Voluntary Scope 3 TAM = 165M sq ft × $0.75/sq ft = ~$124M/yr.

F500/SBTi Scope 3 voluntary spend estimated at $0.75/sq ft, consistent with voluntary carbon market pricing at $268/ton.

Triangle Digital© 2026 Triangle Digital. All rights reserved.
NYC LL97 Analysis · March 2026 · For informational purposes only